Of course, one expects the overall costs of appraisal to go up for non-driveable repairs. But we noticed that both supplement probability and costs also increased. Some of this must have to do with the nature of non-drives, but estimate accuracy is also a major factor in supplement outcomes.
Thus the question: is double normal? Or is there an opportunity to dig deeper and find ways to avoid these costs? We think so. The following Data Dive is part of an ongoing series of eye-opening facts derived from using the vast database analysis tools available with Audatex Insight.
Analysis in brief
It is no secret that there are significant differences between driveable and non-driveable vehicles in terms of repair costs.
Using Audatex Insight, we conducted a 2017 national review of hundreds of thousands of repairable files and found discrepancies that raised a few eyebrows. Namely, in the characteristics of supplements: non-drives have noticeably more frequent and more costly sups.

It makes sense that the bill would be higher for non-drives, but why the apparent drop in initial estimate accuracy? Or is there a third variable that we’re missing? Only further investigation can tell.
Deeper analysis
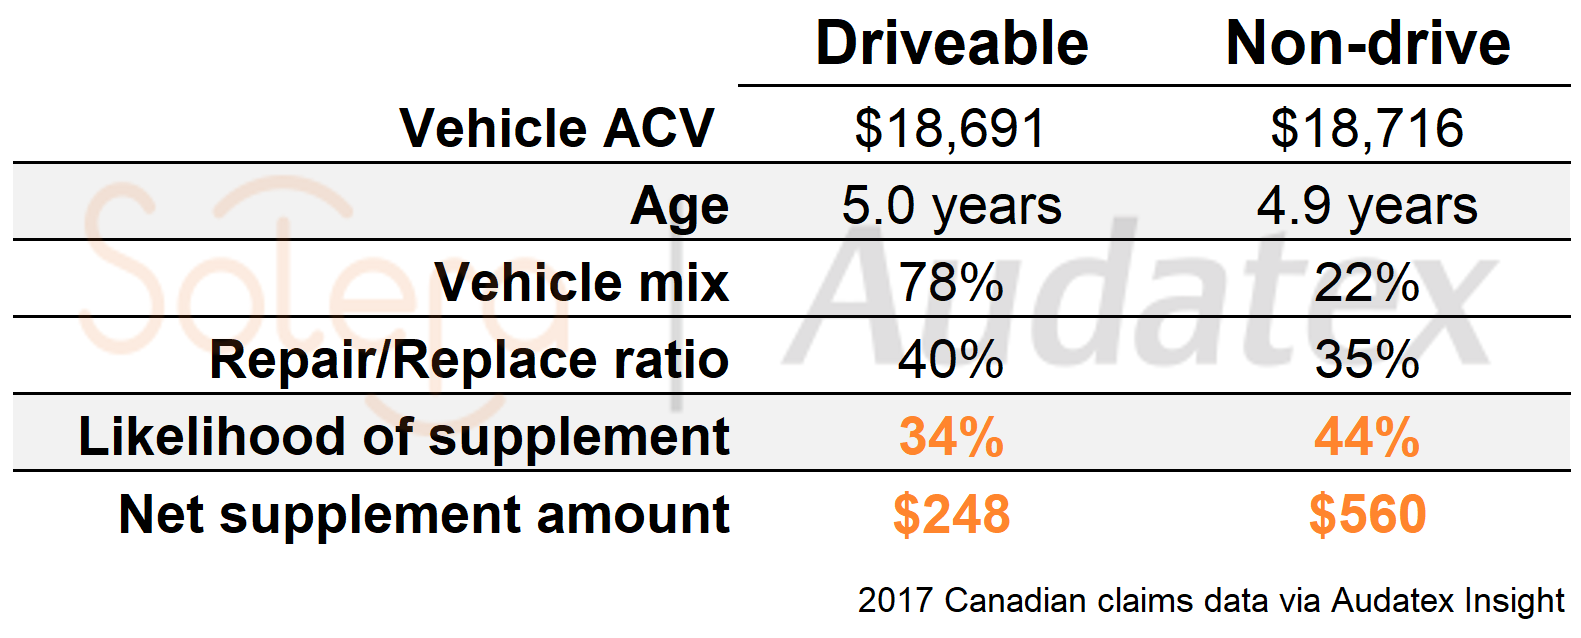
First of all, the physical characteristics of vehicles in the two groups are similar. For example, the average vehicle age (5.0 years for driveable versus 4.9 years for non-drive) and actual cash value – ACV ($18,691 vs $18,716) – are virtually identical.
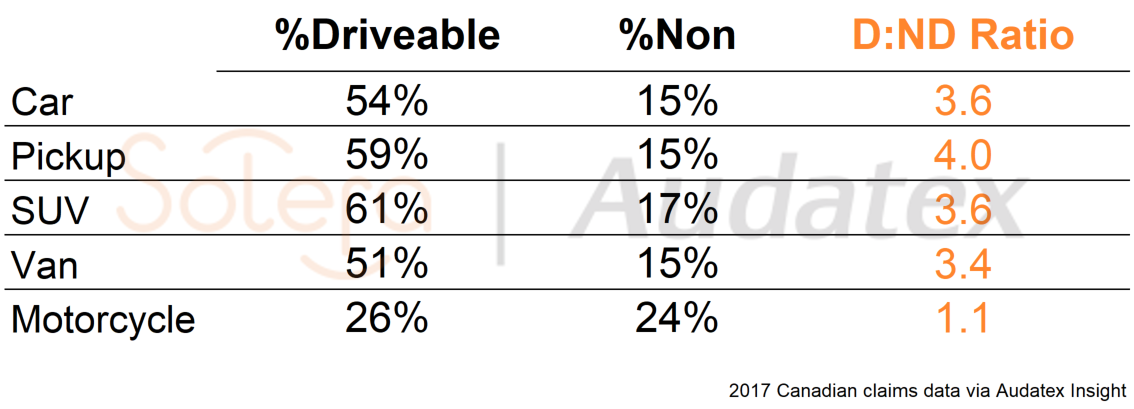
Similarly, the driveable:non-drive ratio is similar among the major vehicle classes. Cars, trucks, SUVs and vans all come in at about 4 drives to every 1 non-driveable. The only exception are motorcycles, which have an almost equal ratio of driveable to non-drive estimates. This is all to be expected, as the odds of a collision rendering a vehicle non-driveable is directly related to the vehicle’s fragility. The classes that clock in at 4:1 share a similar ‘toughness.’ Motorcycles are much more fragile, so the 1:1 ratio makes sense.
 The divergence begins with the analysis of estimate characteristics:
- Non-drive appraisal values are over double that of driveable vehicles, labour hours are nearly double as well.
- Parts cost as a % of ACV is higher, primarily due to more inner parts required for heavier hits.
- Since less labour is required on a percentage basis due to economies of scale, this increases the part %.
- Repair / replace ratio is lower with non-drive, probably due to more parts overall required, many of which can’t be repaired.
These can all be explained by the obvious notion that non-driveable estimates are strongly correlated with heavier hits. But the following is much less straightforward:
- The likelihood of a supplement increases with non-drives (44% vs 34%), and perhaps most importantly,
- The net cost of all non-drive supplements are more than double.

What gives?
Yes, it is fair to assume that non-drive situations involve claims of higher complexity, so a slight increase in supplement frequency is fair. Ten percentage points feels like a wide margin (or at least one that could be compressed), but even if we thought that was fine, a 126% increase in the associated costs raise a big fat yellow flag. Given that many non-drives estimates are written following a tear-down (or at least, they should be), we would expect the estimate accuracy to be better than observed.
As such, we cannot help but think there is a considerable opportunity to reduce cycle time and supplement costs, specifically in the area of non-driveable claims.
Tools like Audatex Insight can help identify these areas of potential concern, and solutions like AudaTarget can help address them.
Using AudaTarget, one can configure the system to pay attention to historical differences between driveable and non-driveable repairs within a DRP or MSO network. If there is an issue in terms of efficiency, any problematic shops would show up as having unusually high Normalized Cost of Repair (NCR) scores. If indeed the observed data are simply reflective of the nature of non-drive conditions, we would expect to see little difference in NCR scores across shops, (when configured to differentiate between non-drive and driveable classification).
The only way to find out? Dive even deeper with the data.
To learn more about using either Audatex Insight or AudaTarget to help realize greater efficiencies with your network of shops, please contact your account manager or call our general line.


